
Show failover scenarios as side breakouts to add function to high-level diagrams to help the audience understand data flow when service is lost. Use the following steps to quickly duplicate a simplified copy of your diagram and overlay data paths.
Example 17-1
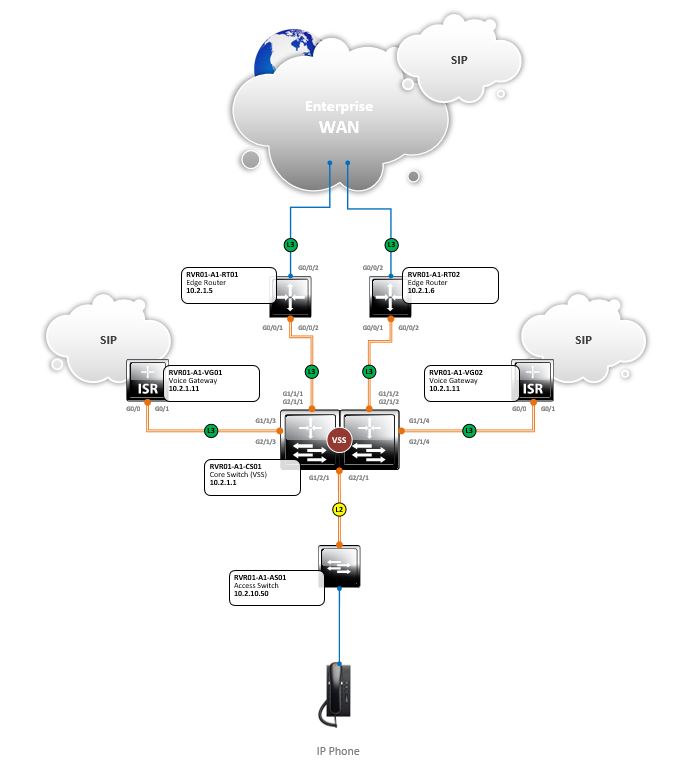
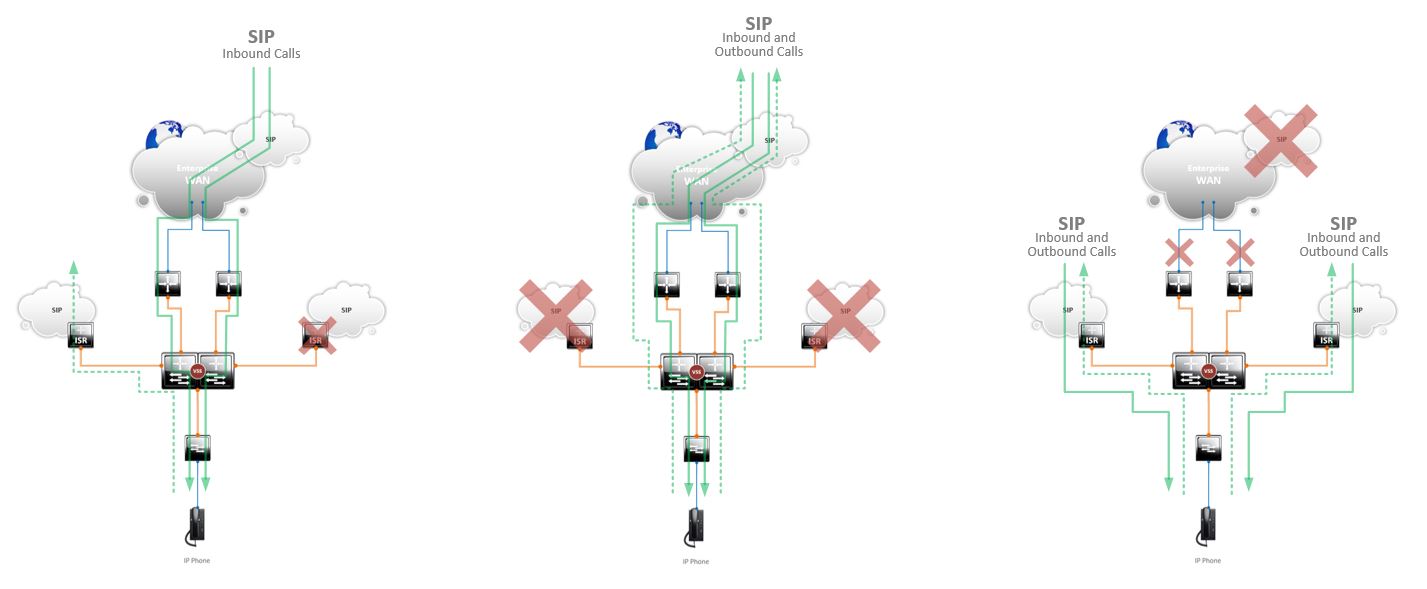
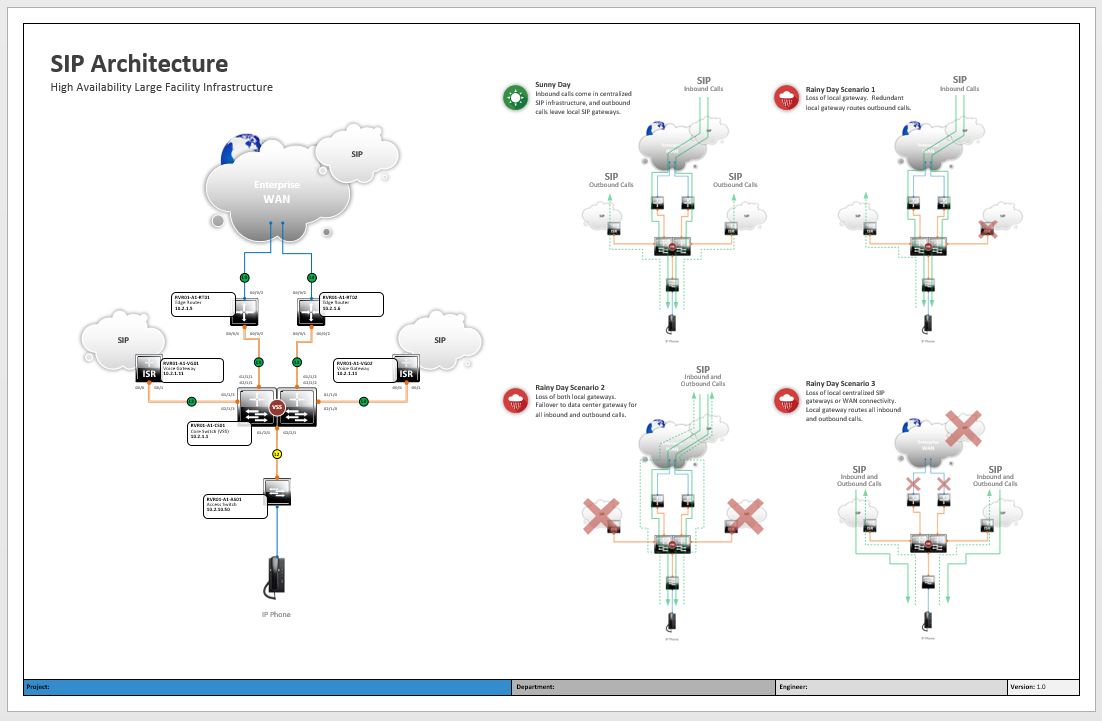
Start by taking the finished drawing, which in this case is for a large facility SIP infrastructure. The specific audience is interested in seeing how the redundant infrastructure handles different failure scenarios, so I want to show the overall components with the scenarios broken out to the side.
Example 17-2
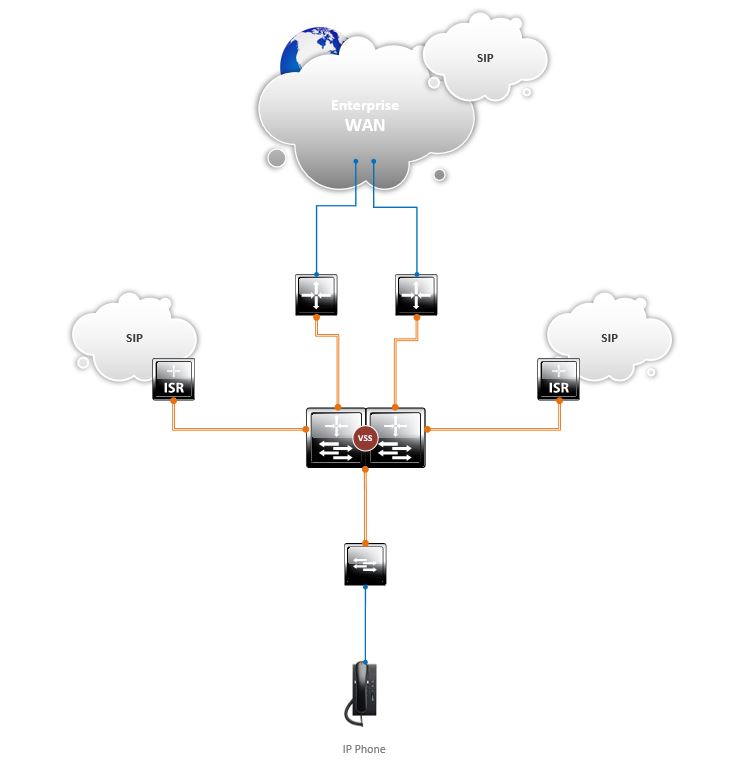
Next, with a duplicated diagram, remove any technical information and description tags since it is not needed.
Example 17-3
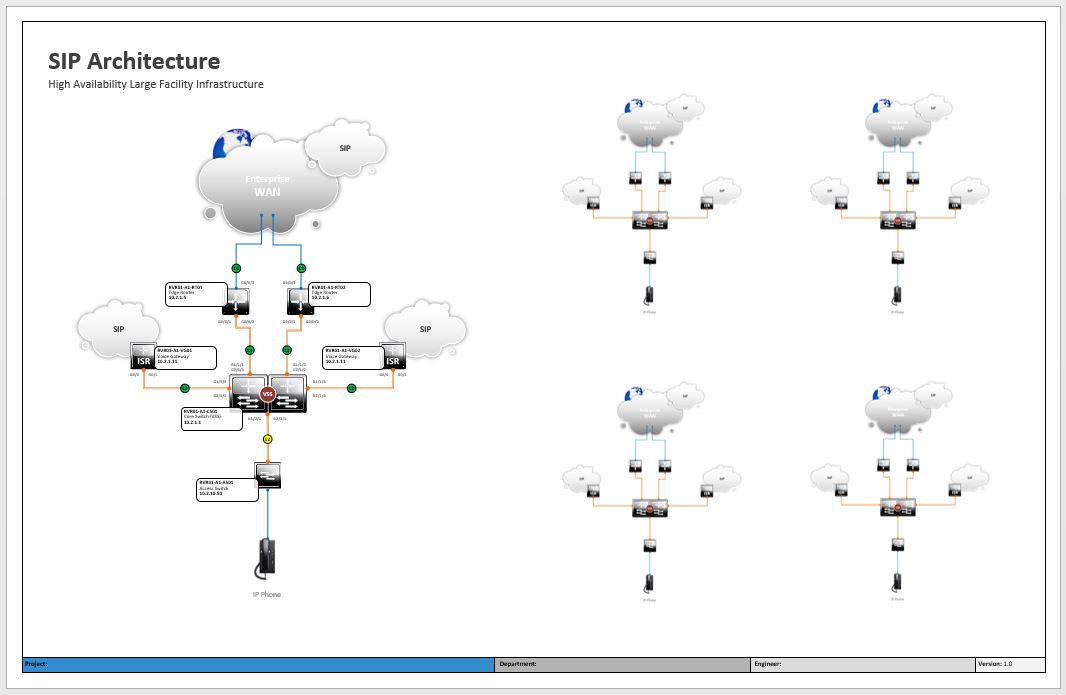
Take a screenshot using a snipping tool or Paint, place it in your diagram, and reduce the size so you can fit multiple scenarios in the overall diagram. In this example, we are going to show 4 scenarios. Use your knowledge from TIP 16 to lock the images in place, so you can overlay lines without accidentally selecting the placed images.
Example 17-4
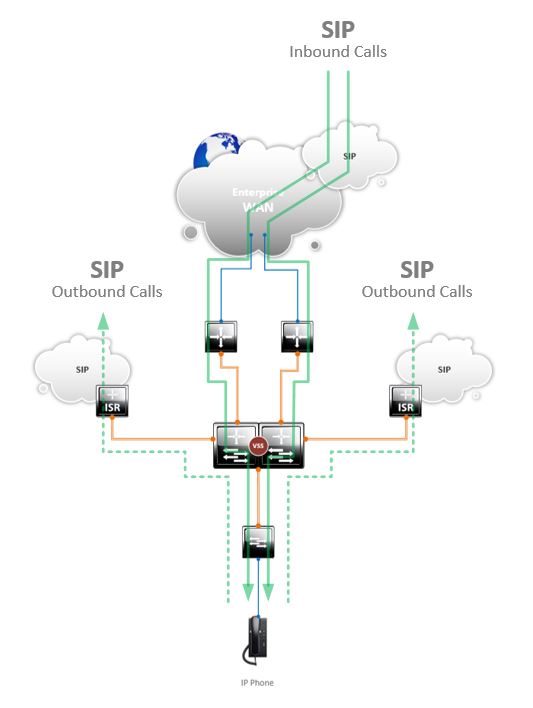
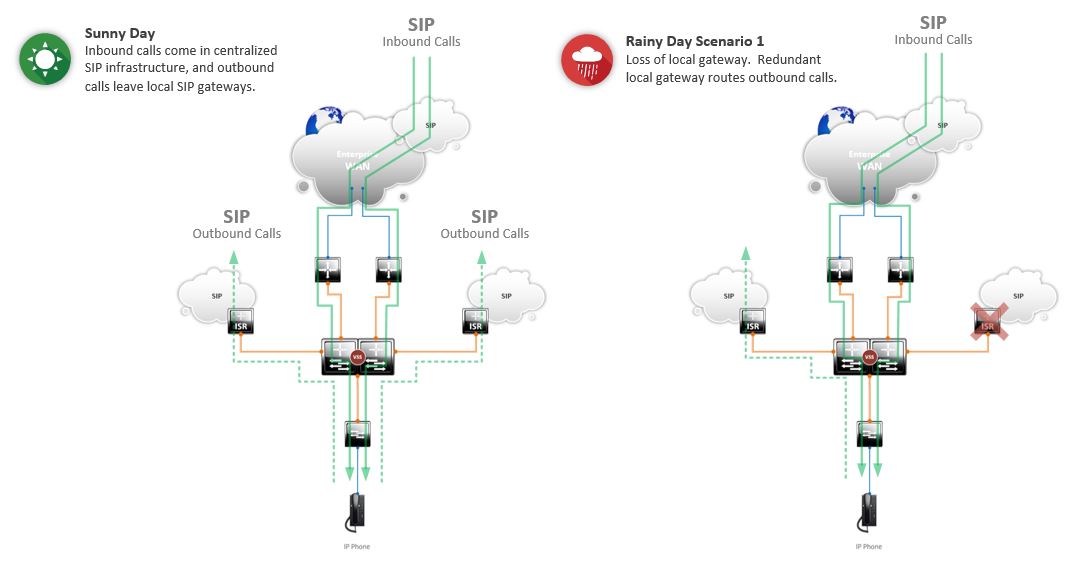
Zoom in to the first diagram and draw what would be a “Sunny Day” data flow, with all components working as designed. Call out any difference in data flows such as the inbound and outbound calls in this example.
Example 17-5
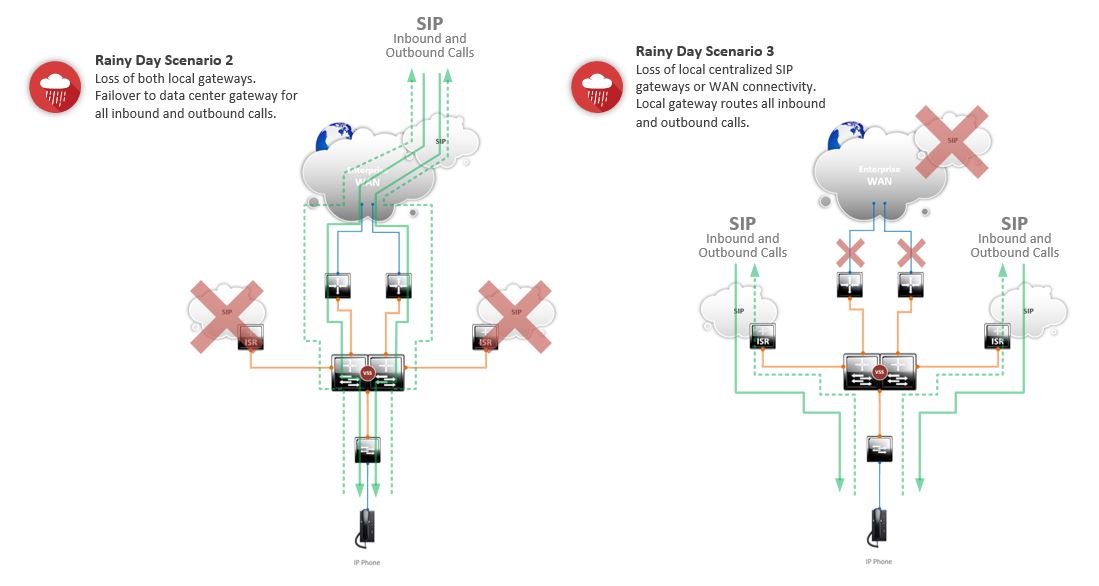
Repeat the data flows, showing how a “Rainy Day” scenario changes when specific components fail. In this example, a single local gateways fails, both local gateways fail, and the last shows centralized SIP infrastructure and/or complete WAN failure.
Example 17-6
Add a quick explanation of what each scenario depicts, along with an eye-catching icon.
Example 17-7
Final diagram.
< TIPTIP >
 Diagram Store