
Avoid crossing links when possible. Think a little outside of the box on how to visually represent two points connecting without cluttering up your diagram with clunky lightening bolts.
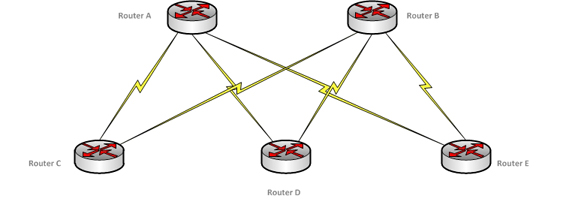
Example 4-1
Here’s a classic example of what crossing “lightening bolts” looks like. Not good. The days of point to point circuits are numbered, but sometimes you don’t have much of a choice.
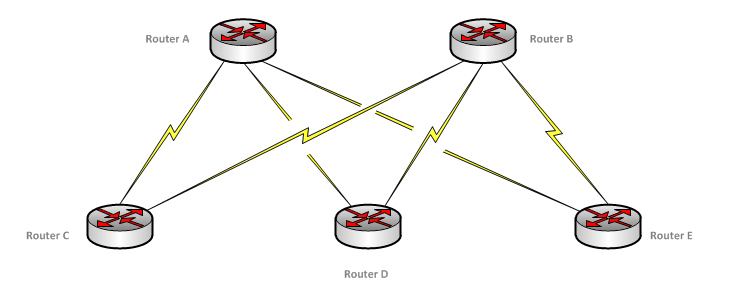
Example 4-2
The easiest option is to insert some white space (or color of background) between bolts to clean up the intersecting area. This airs it out visually, and while not optimal, it is an improvement over the example above. The trick is to slip the whit box/shape in between bolts using the “send backward” function (Shift+Ctrl+B).
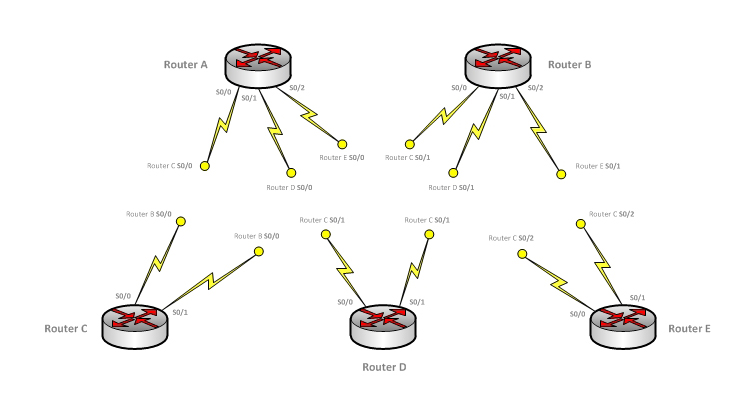
Example 4-3
If you want to avoid crossing completely you can identify where the other end of the bolt connects, creating a “virtual” circuit. While it might be a little hard to visualize with the example below, this would be useful if you had to have a connection stretch across a large map but had a lot of content in between. As long as the information is there, it is just as effective to represent the connection between devices instead of disrupting the flow of the overall diagram.
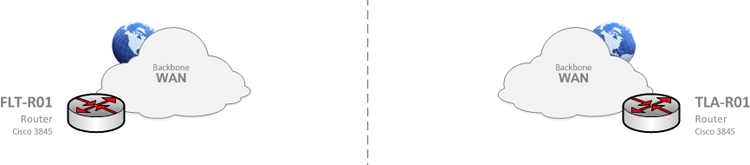
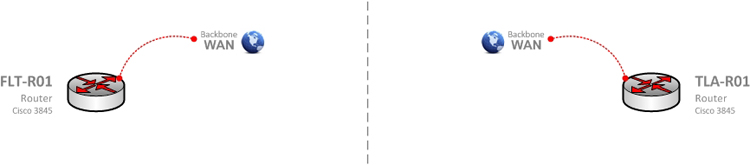
Example 4-4
With the emergence of cloud technologies, metro Ethernet, and VPN, the trusty old lightening bolt is not as useful as it once was. This is great news for map lovers! We can toss the bolt and look to new, creative ways to represent WAN connectivity. In the example below, I simply use a small cloud to show an MPLS WAN backbone. The same labeled cloud is used for the second router and can be located in any area of the diagram; but it is easy to deduce that both routers have access to the same cloud. I realize this isn’t necessarily earth-shattering, but it shows that you do not need to be confined to the same cloud or circuit as long as it’s easy to understand.
Example 4-5
This example is similar to the one above, but instead of a cloud, it is simply represented by a curved line and small graphic element to reduce space.
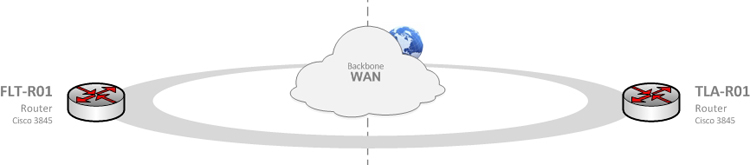
Example 4-6
One of my favorite ways to represent a large amount of WAN routers using the same cloud is with concentric rings. As long as the ring is clearly labeled with carrier, technology, etc., your audience will quickly understand what it means. This works great for multiple service provider environments, making each ring a different carrier cloud.
< TIPTIP >
 Diagram Store